Bellingham WA Real Estate Market Update – September 2026
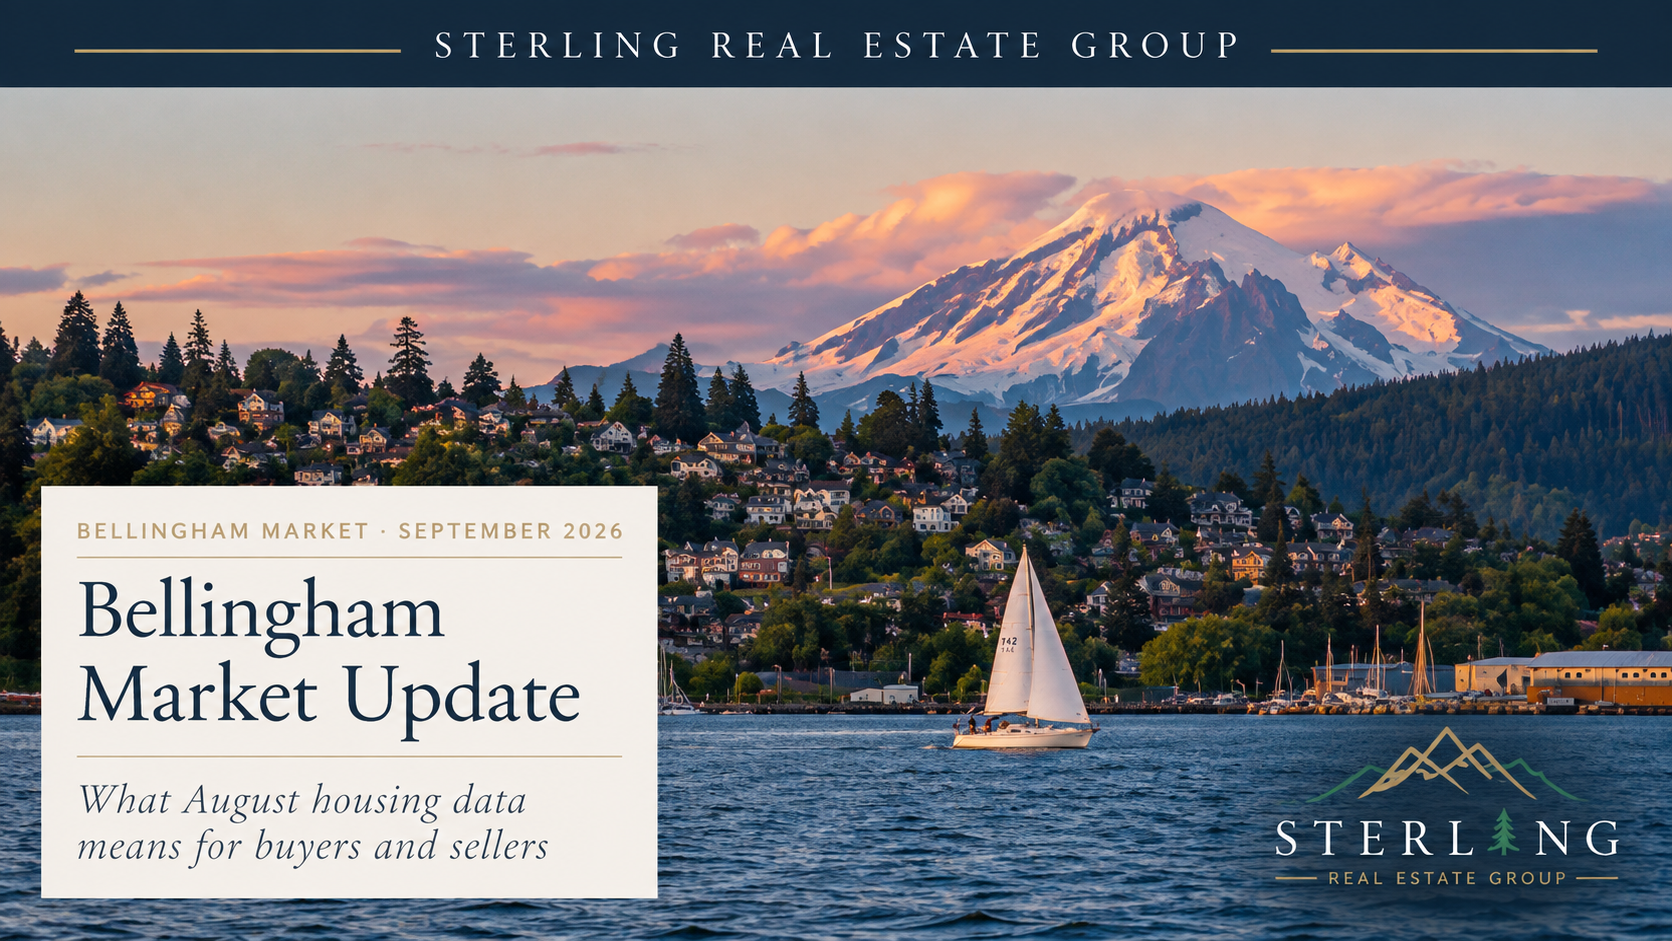
August 2026 housing market data, home prices, inventory and sales trends — and what the latest numbers mean for Bellingham buyers and sellers.
The Bellingham WA real estate market entered fall with more homes available to buyers, slightly softer prices, and fewer completed sales than a year ago.
According to Northwest Multiple Listing Service® data for August 2026, the median sales price in Bellingham was $697,500, down 2.3% from $713,750 in August 2025. At the same time, the number of homes for sale increased 7.3% year over year, giving buyers more choices than they had last summer.
But the numbers also show that Bellingham remains an active market. The median home that sold in August spent just 10 days on the market, compared with 11 days a year earlier.
Bellingham Market at a Glance
Year-over-year comparison with August 2025
August 2026 compared with August 2025
Bellingham buyers had more homes to choose from in August while prices softened modestly and sales activity slowed. Well-positioned homes, however, continued to sell quickly.
August 2026 Bellingham Housing Market Data
| Market Metric | Aug. 2026 | Aug. 2025 | Change |
|---|---|---|---|
| Median Sales Price | $697,500 | $713,750 | -2.3% |
| Average Sales Price | $820,175 | $827,179 | -0.8% |
| New Listings | 168 | 166 | +1.2% |
| Homes for Sale | 339 | 316 | +7.3% |
| Pending Sales | 107 | 118 | -9.3% |
| Closed Sales | 106 | 115 | -7.8% |
| Median Days on Market | 10 | 11 | -1 Day |
| Average Days on Market | 31 | 31 | No Change |
| Months Supply – Closed | 3.8 | 3.7 | +2.7% |
| Median Price / Sq. Ft. | $390 | $403 | -3.2% |
| Dollar Volume | $86.94M | $95.13M | -8.6% |
Are Bellingham Home Prices Going Up or Down?
Bellingham home prices were slightly lower in August than they were one year ago.
The median sales price declined from $713,750 in August 2025 to $697,500 in August 2026, a decrease of approximately 2.3%. The average sales price moved less, falling from $827,179 to $820,175, or about 0.8%.
Price per square foot also softened. The median price per square foot was $390 in August, compared with $403 one year earlier.
Those figures point to a market that has become somewhat more price-sensitive rather than one experiencing a dramatic shift in values.
Bellingham Buyers Have More Homes to Choose From
One of the more important changes in the Bellingham housing market is inventory.
There were 339 Bellingham homes for sale in August 2026 compared with 316 in August 2025 — an increase of approximately 7.3%.
New listing activity was relatively stable, with 168 new listings during August compared with 166 one year earlier.
Months of inventory based on closed sales increased slightly from 3.7 months to 3.8 months.
For buyers, additional inventory can mean more opportunity to compare homes, neighborhoods and pricing instead of having to make decisions with extremely limited choices.
Bellingham Sales Activity Slowed
While inventory increased, fewer properties went under contract or closed.
Bellingham recorded 107 pending sales in August, down from 118 a year earlier — a decrease of approximately 9.3%.
Closed sales declined from 115 to 106, a decrease of approximately 7.8%.
Total closed-sales dollar volume consequently fell from approximately $95.13 million in August 2025 to $86.94 million in August 2026.
This combination — more inventory alongside fewer pending and closed transactions — gives buyers more breathing room than they may experience during tighter periods of the Bellingham market.
Are Bellingham Homes Taking Longer to Sell?
Interestingly, not necessarily.
Median days on market decreased from 11 days last August to 10 days in August 2026. Average days on market remained unchanged at 31 days.
The difference between the 10-day median and 31-day average is important. Some homes are still selling quickly, while properties that remain available longer can pull the average considerably higher.
Pricing, condition, location and property type continue to matter.
Are Bellingham Sellers Getting Their Asking Price?
Homes that closed in August sold for an average of 98.8% of their last list price, compared with 98.2% one year earlier.
The median was 100% of last list price in both periods.
Compared with the original asking price, however, the median was approximately 98.7% in August 2026.
That distinction matters. A home can ultimately sell close to its current list price after a seller has already made one or more price adjustments.
For sellers, accurate initial pricing remains especially important as buyers gain more inventory to choose from.
What Does the Market Mean for Bellingham Buyers?
The August numbers give Bellingham buyers some encouraging signs. Inventory is higher, the median sales price is slightly lower year over year, and pending and closed sales have slowed.
Buyers may therefore encounter more choices and potentially more negotiating opportunities than they would in tighter market conditions.
That does not mean every property will be easy to negotiate. Well-positioned homes can still move quickly — the median sold property was on the market only 10 days in August.
Buyers should evaluate the individual property, its neighborhood, comparable sales and time on market rather than assuming the entire Bellingham market behaves the same way.
What Does the Market Mean for Bellingham Sellers?
For sellers, the August data reinforces the importance of pricing correctly from the beginning.
Buyers had 7.3% more active inventory to choose from than they did a year ago, while the number of pending sales declined.
At the same time, homes that do sell are still achieving close to their most recent asking prices.
Strong presentation, accurate pricing and understanding the competition within a home's specific neighborhood and price range can make a significant difference.
Bellingham Is Not One Housing Market
Citywide statistics are useful, but they do not tell the entire story. Housing in Bellingham varies significantly by neighborhood, property type, condition, lot size, views and proximity to amenities.
Waterfront property can behave very differently from a condominium, newer construction or an established single-family neighborhood.
See Bellingham Homes, Neighborhoods & Local Real Estate
Sterling tracks individual Bellingham neighborhoods so buyers and sellers can look beyond citywide averages when evaluating a property.
Explore Bellingham Real Estate →Bellingham Real Estate Outlook for Fall 2026
August's numbers point to a Bellingham housing market with more inventory and somewhat less transaction activity than last year.
Prices have softened modestly rather than dramatically. Inventory has expanded. Pending and closed sales are lower. Yet appropriately positioned homes can still sell quickly and close near their most recent asking price.
As we move through fall, Sterling will be watching whether inventory continues to build, how quickly new listings are absorbed, and whether the recent moderation in prices continues.
Sterling Real Estate Group will update these numbers as new Northwest MLS data becomes available.
Frequently Asked Questions About the Bellingham Housing Market
What was the median home price in Bellingham in August 2026?
The median sales price for residential property in Bellingham was $697,500 in August 2026, compared with $713,750 in August 2025.
How long are homes taking to sell in Bellingham?
Median days on market was 10 days in August 2026. The average was 31 days, showing that market time can vary considerably between individual properties.
Is Bellingham housing inventory increasing?
Bellingham had 339 homes for sale in August 2026 compared with 316 in August 2025, an increase of approximately 7.3%.
Are Bellingham homes selling for asking price?
The median sale was 100% of its last list price in August, while the average was approximately 98.8%. Compared with original list price, the median was approximately 98.7%.
How much housing inventory does Bellingham have?
August recorded approximately 3.8 months of inventory based on closed sales, compared with 3.7 months one year earlier.
Thinking About Buying or Selling in Bellingham?
Citywide statistics are only the starting point. Talk with a local Sterling broker about your property, neighborhood, price range or home search.
Rooted Here. Invested Here.